COVID-19 Update 4/10
This information is pulled from Technomic’s Foodservice Impact Monitor, which shares sentiment and behavior tracking to help support you in the transition from crisis response to near- and long-term planning. View some highlights pulled from the most recent report below.
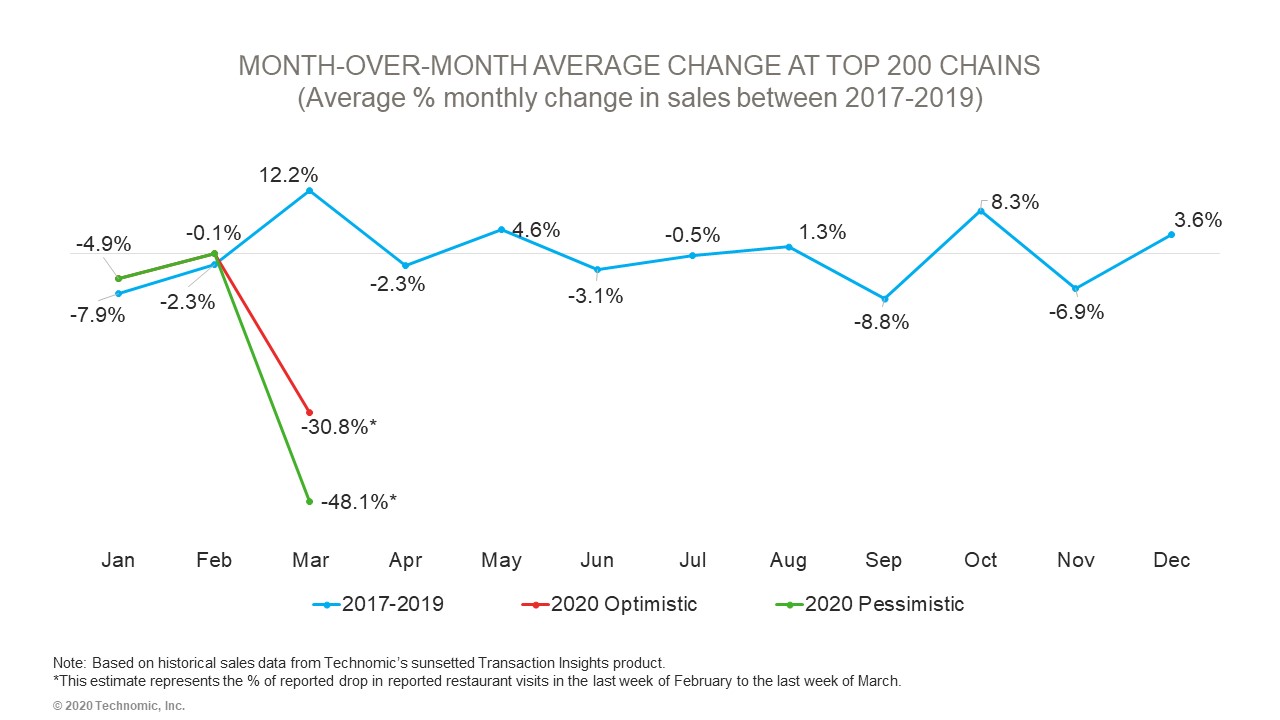
The outbreak hit the industry just as it picked up its momentum for the year
The first two months of the year were shaping up well for the industry, with a roughly 4% increase in sales year over year for the months of January and February—months which are typically slower historically. Typically, March sees 12% higher sales than February—the lowest month of the year. Right now, our preliminary projections for March fall between a 31% and 48% drop in sales from February—a net loss of 43% to 60% from the expected monthly sales gain typically seen in March.
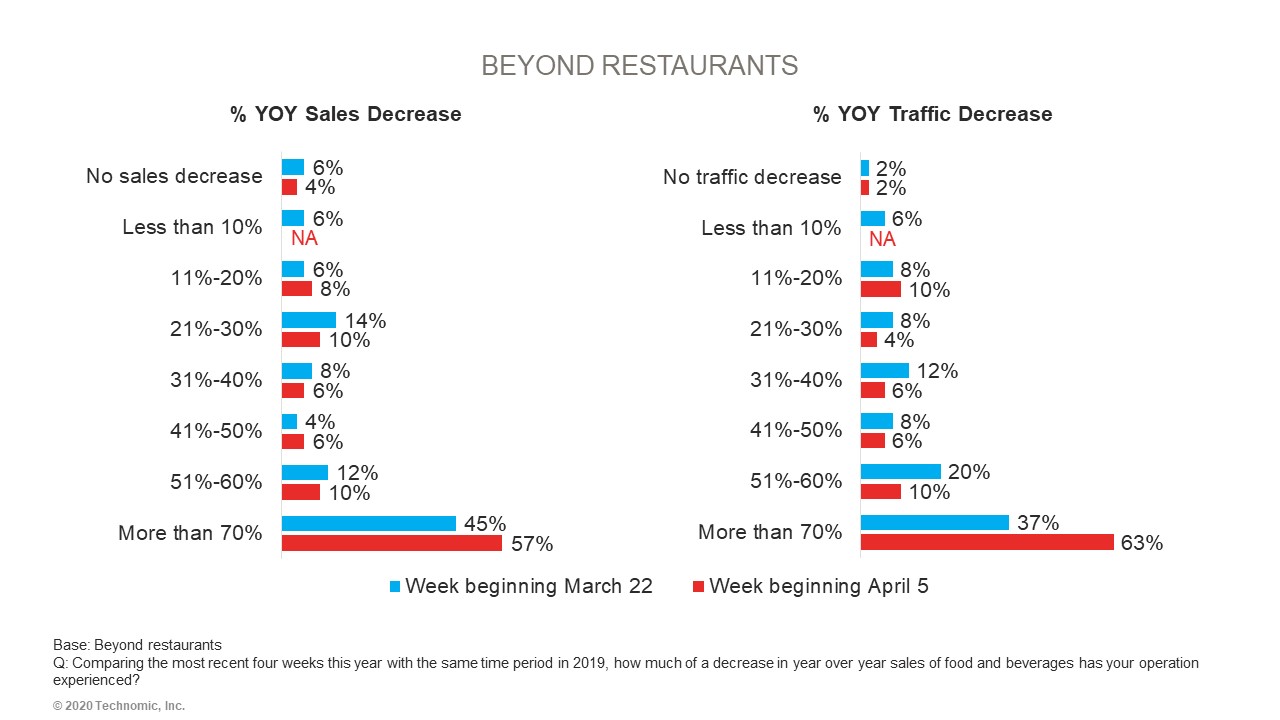
Sales and traffic declines more extreme for beyond restaurant operators
More than half (57%) of beyond restaurant operators report a sales decrease of more than 70% over the prior year, and 63% report a traffic decrease of more than 70% over the prior year. These staggering sales and traffic declines continue to be more prominent for beyond restaurant operators as most are completely shut down and don’t have the opportunity to pivot to delivery or takeout.
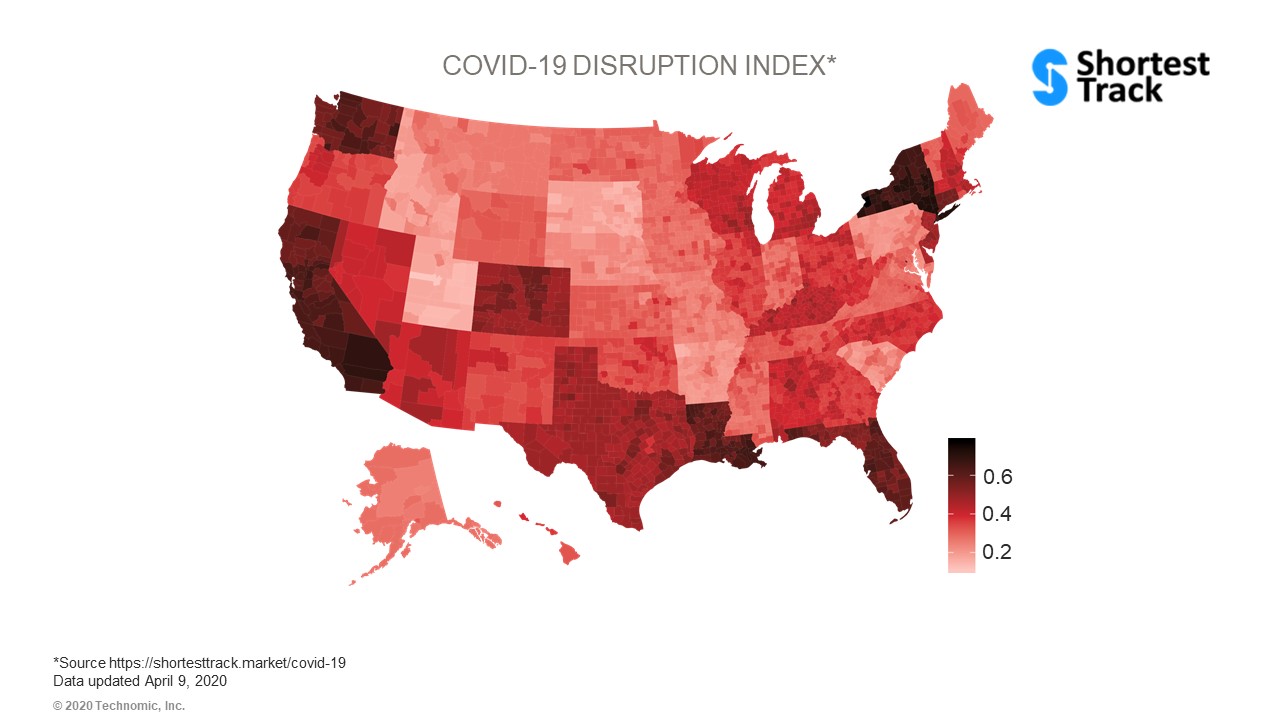
Hot spots are emerging outside of major metropolitan areas
Beyond the obvious urban hot spots, as well as those in California and the Northeast, areas that could experience a prolonged impact are emerging in more rural areas of key states. Counties in eastern Washington and California, as well as rural counties in Louisiana and Florida, are all showing elevated disruption risk. This Disruption Index factors local infection rates, social distancing practices/guidelines, mobile data, population density, disease states that increase risks associated with COVID-19 and other lifestyle factors into the score. Counties with heavier shading indicate a higher disruption score.
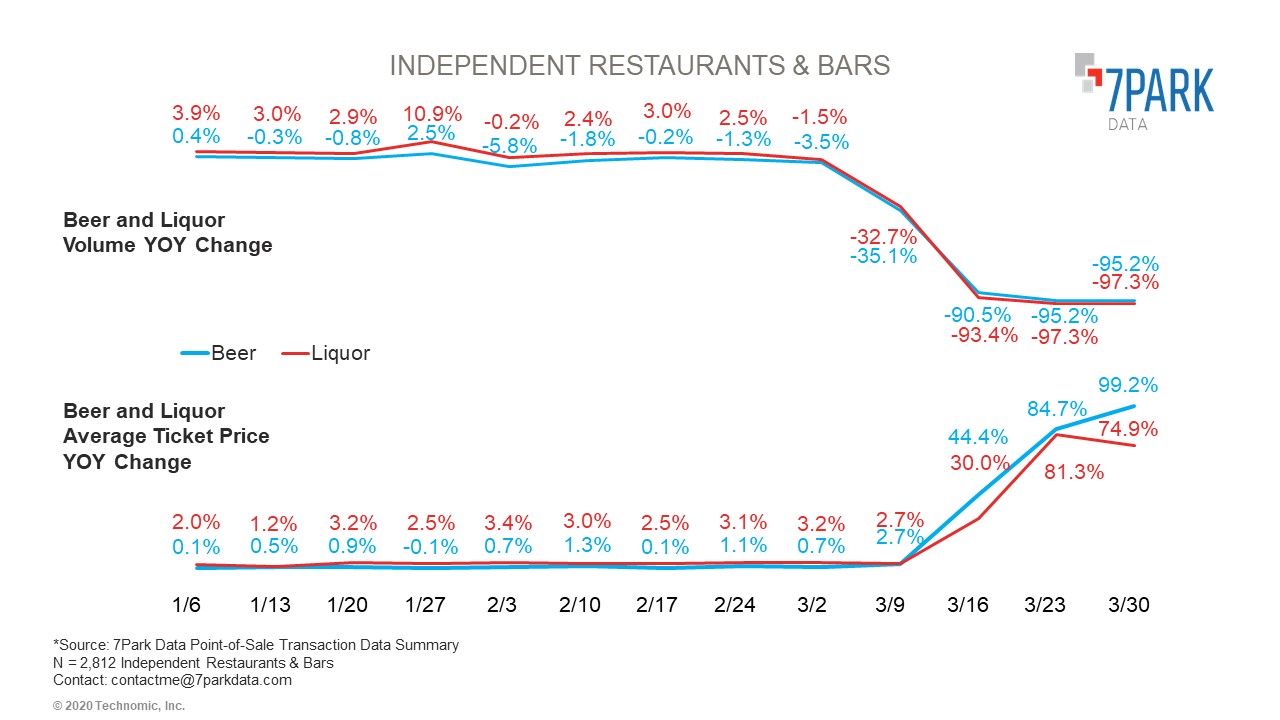
Adult beverages
We have seen a drastic drop in volume of orders placed for adult beverages in March, but an equally drastic rise in the average ticket price of receipts. This is driven by the remaining sales being predominately bulk packaged goods orders. There is a slight drop-off in the average ticket price for liquor receipts for the week of March 30, likely indicating that consumers have a reached a threshold for the ticket price they are willing to pay for liquor.
These graphs depict the year-over-year growth of beer and liquor between the week in 2020 and the corresponding week in 2019.


